Test Report
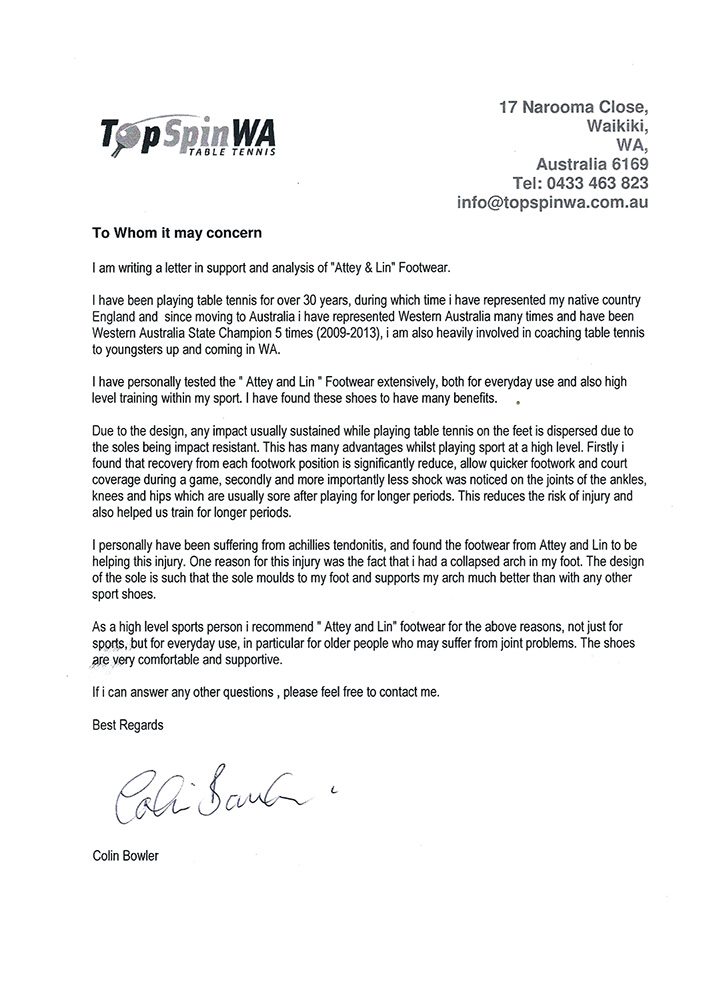
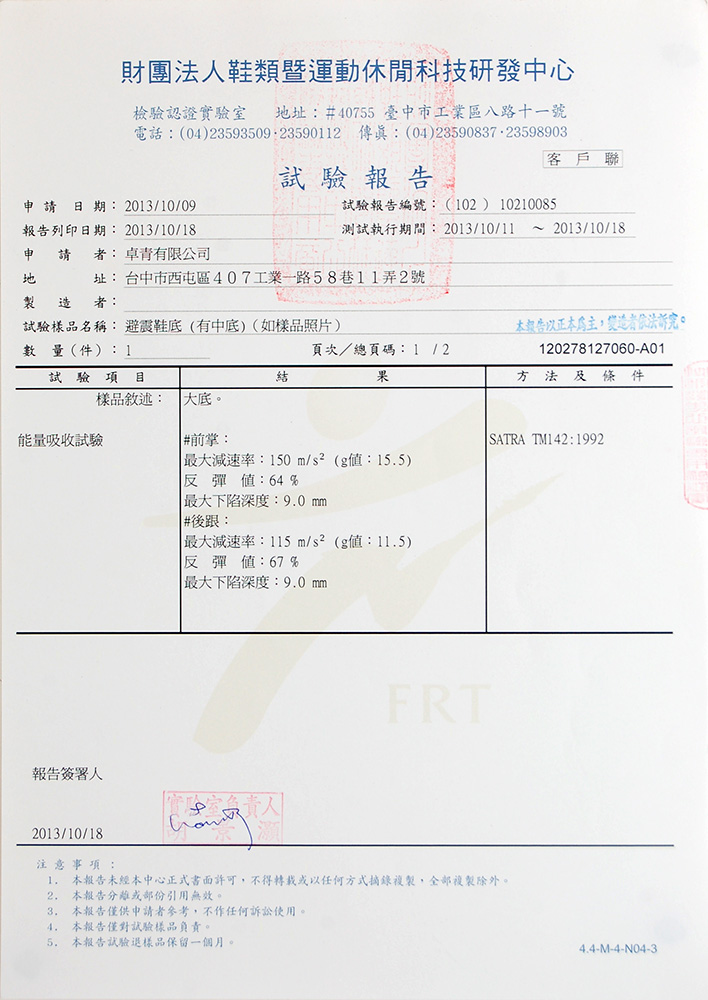
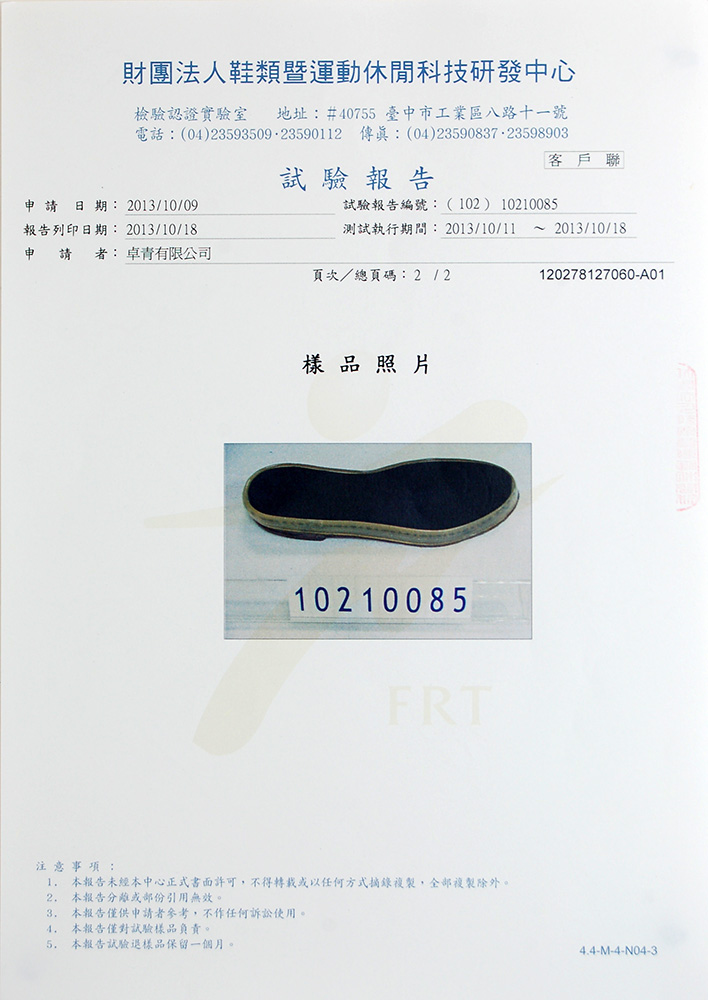
| Test report from a 5-time Western Australia State Champion | Test report from Footwear & Recreation Technology Research Institute | Comparison of “g” factor and energy return | |||||||||||||||||||
 |
 |
 |
|
||||||||||||||||||
Test Method
1. the center of front and back sole of the shoe are compressed by the machine.
2. the material elasticity and energy absorption are determined by the compression test.
Test Instructions
The “G” factor represents the ability of energy absorption. A material absorbs more energy and protects our knee from impact when it has a lower “G” factor.
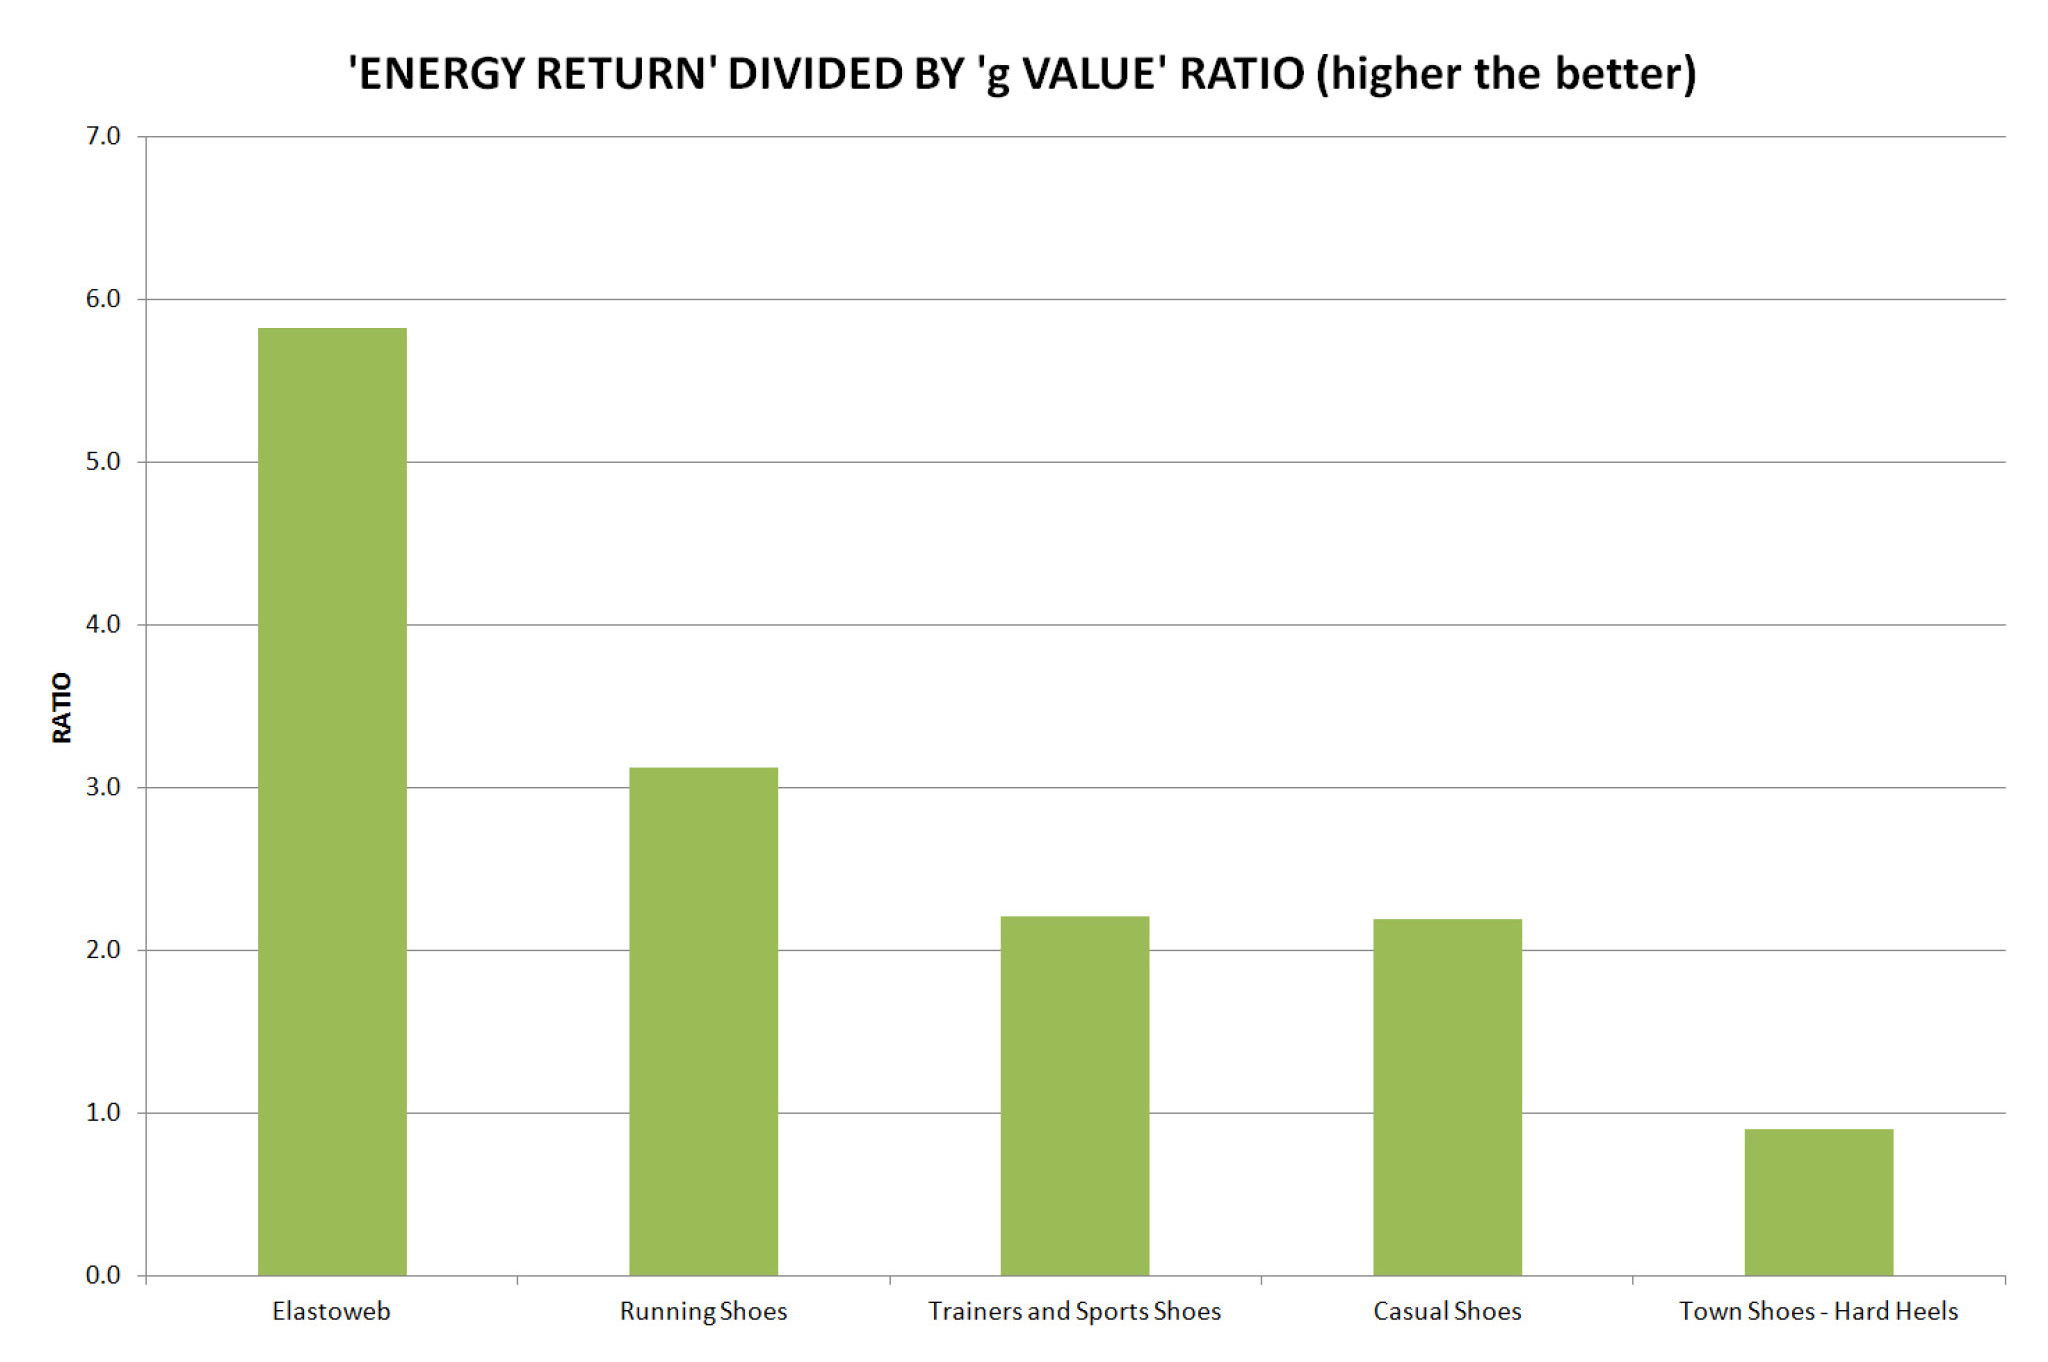
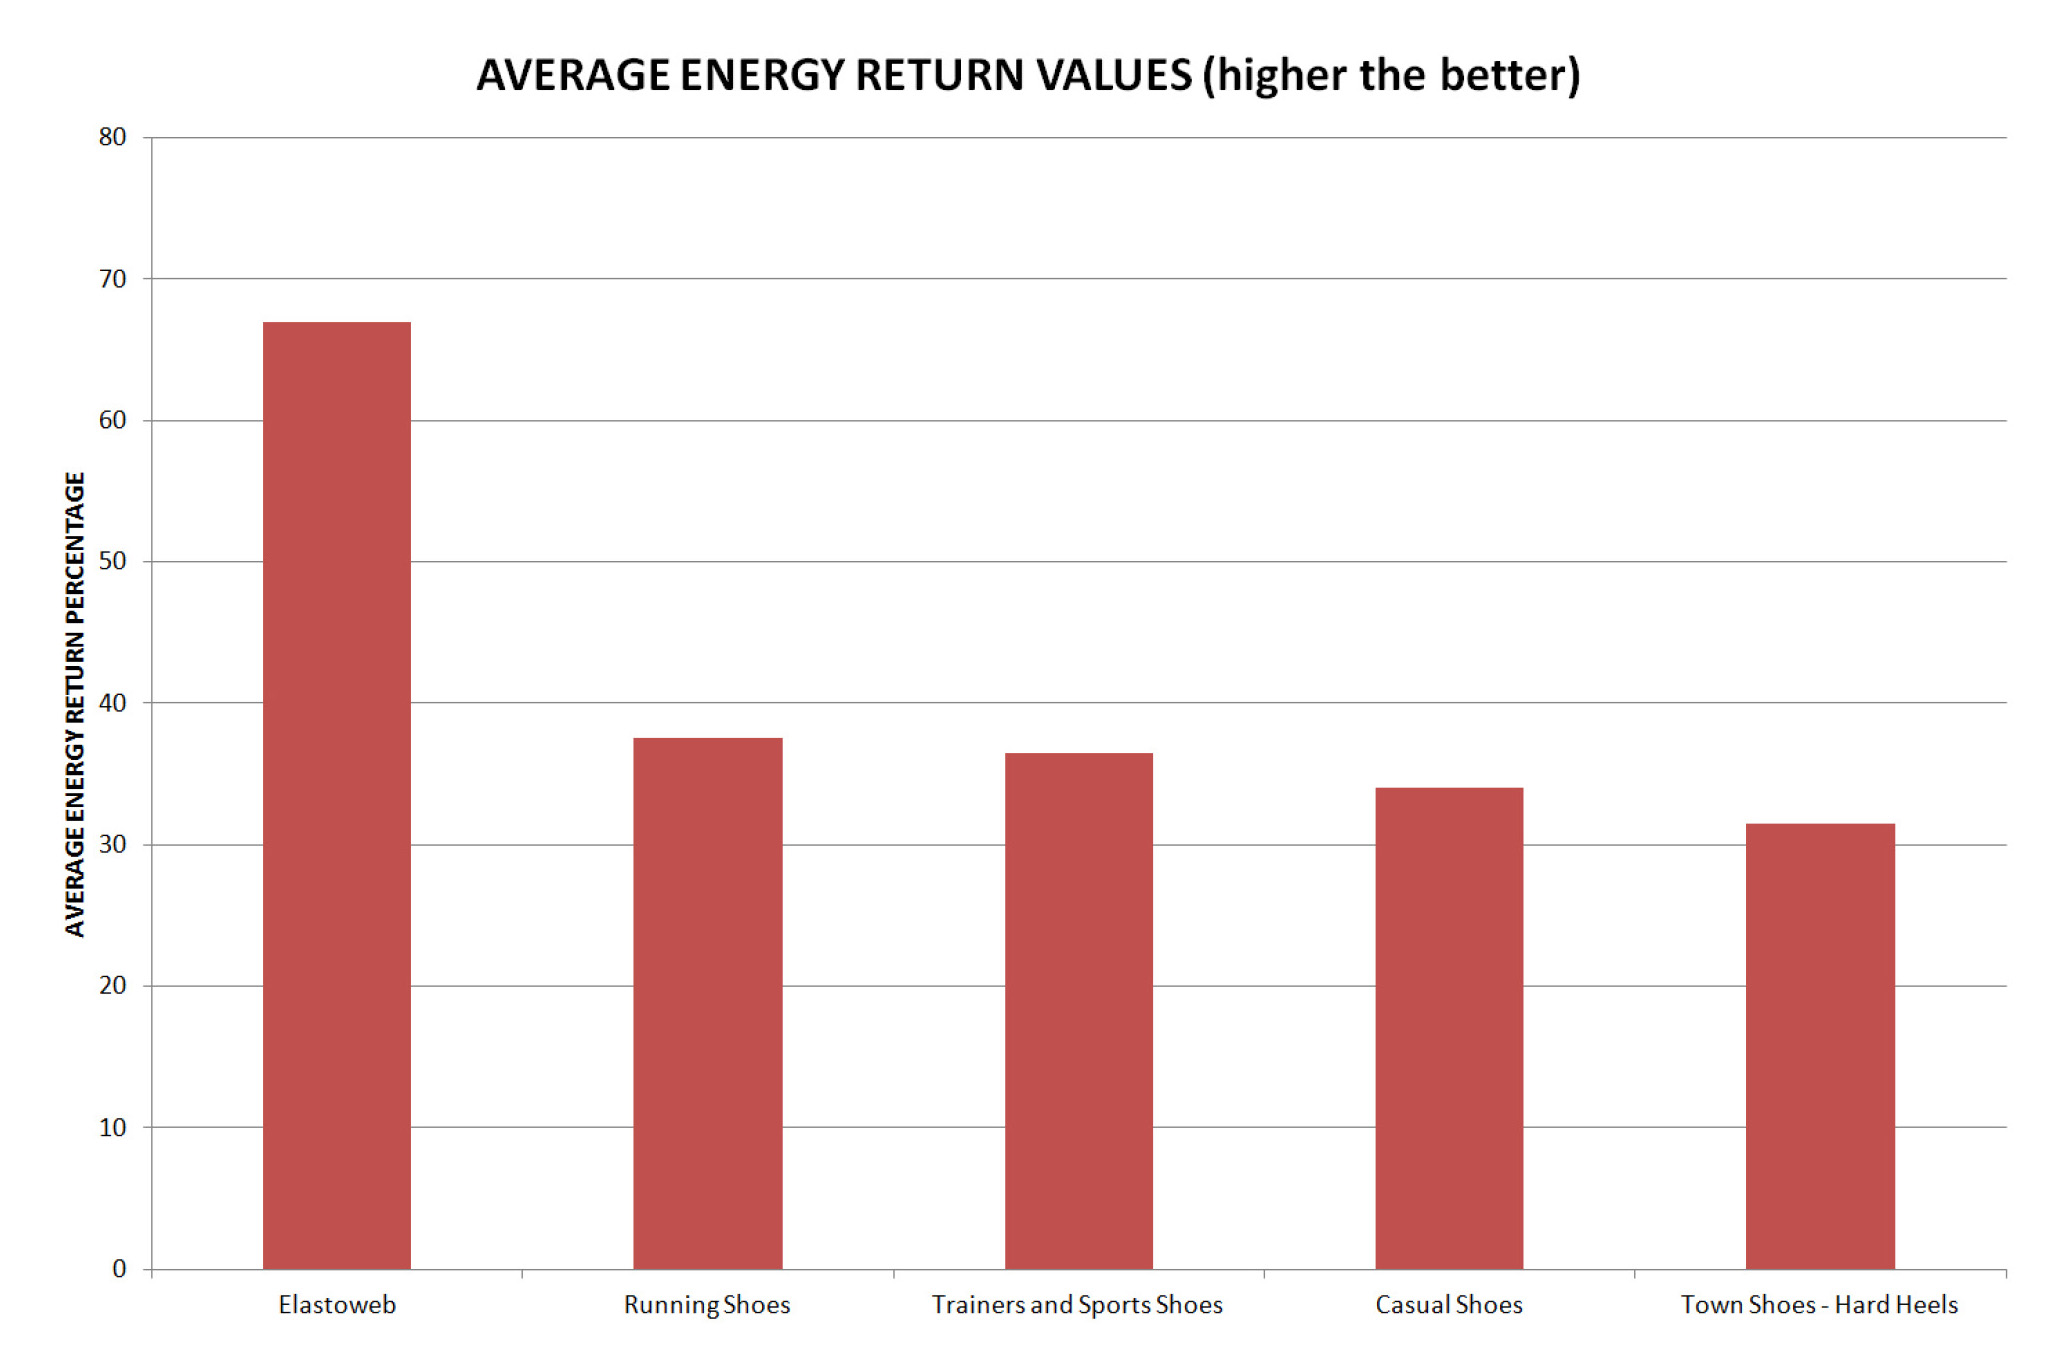
Comparison of different shoe types
Utility=energy return/”g” factor ; higher is better
 |
 |
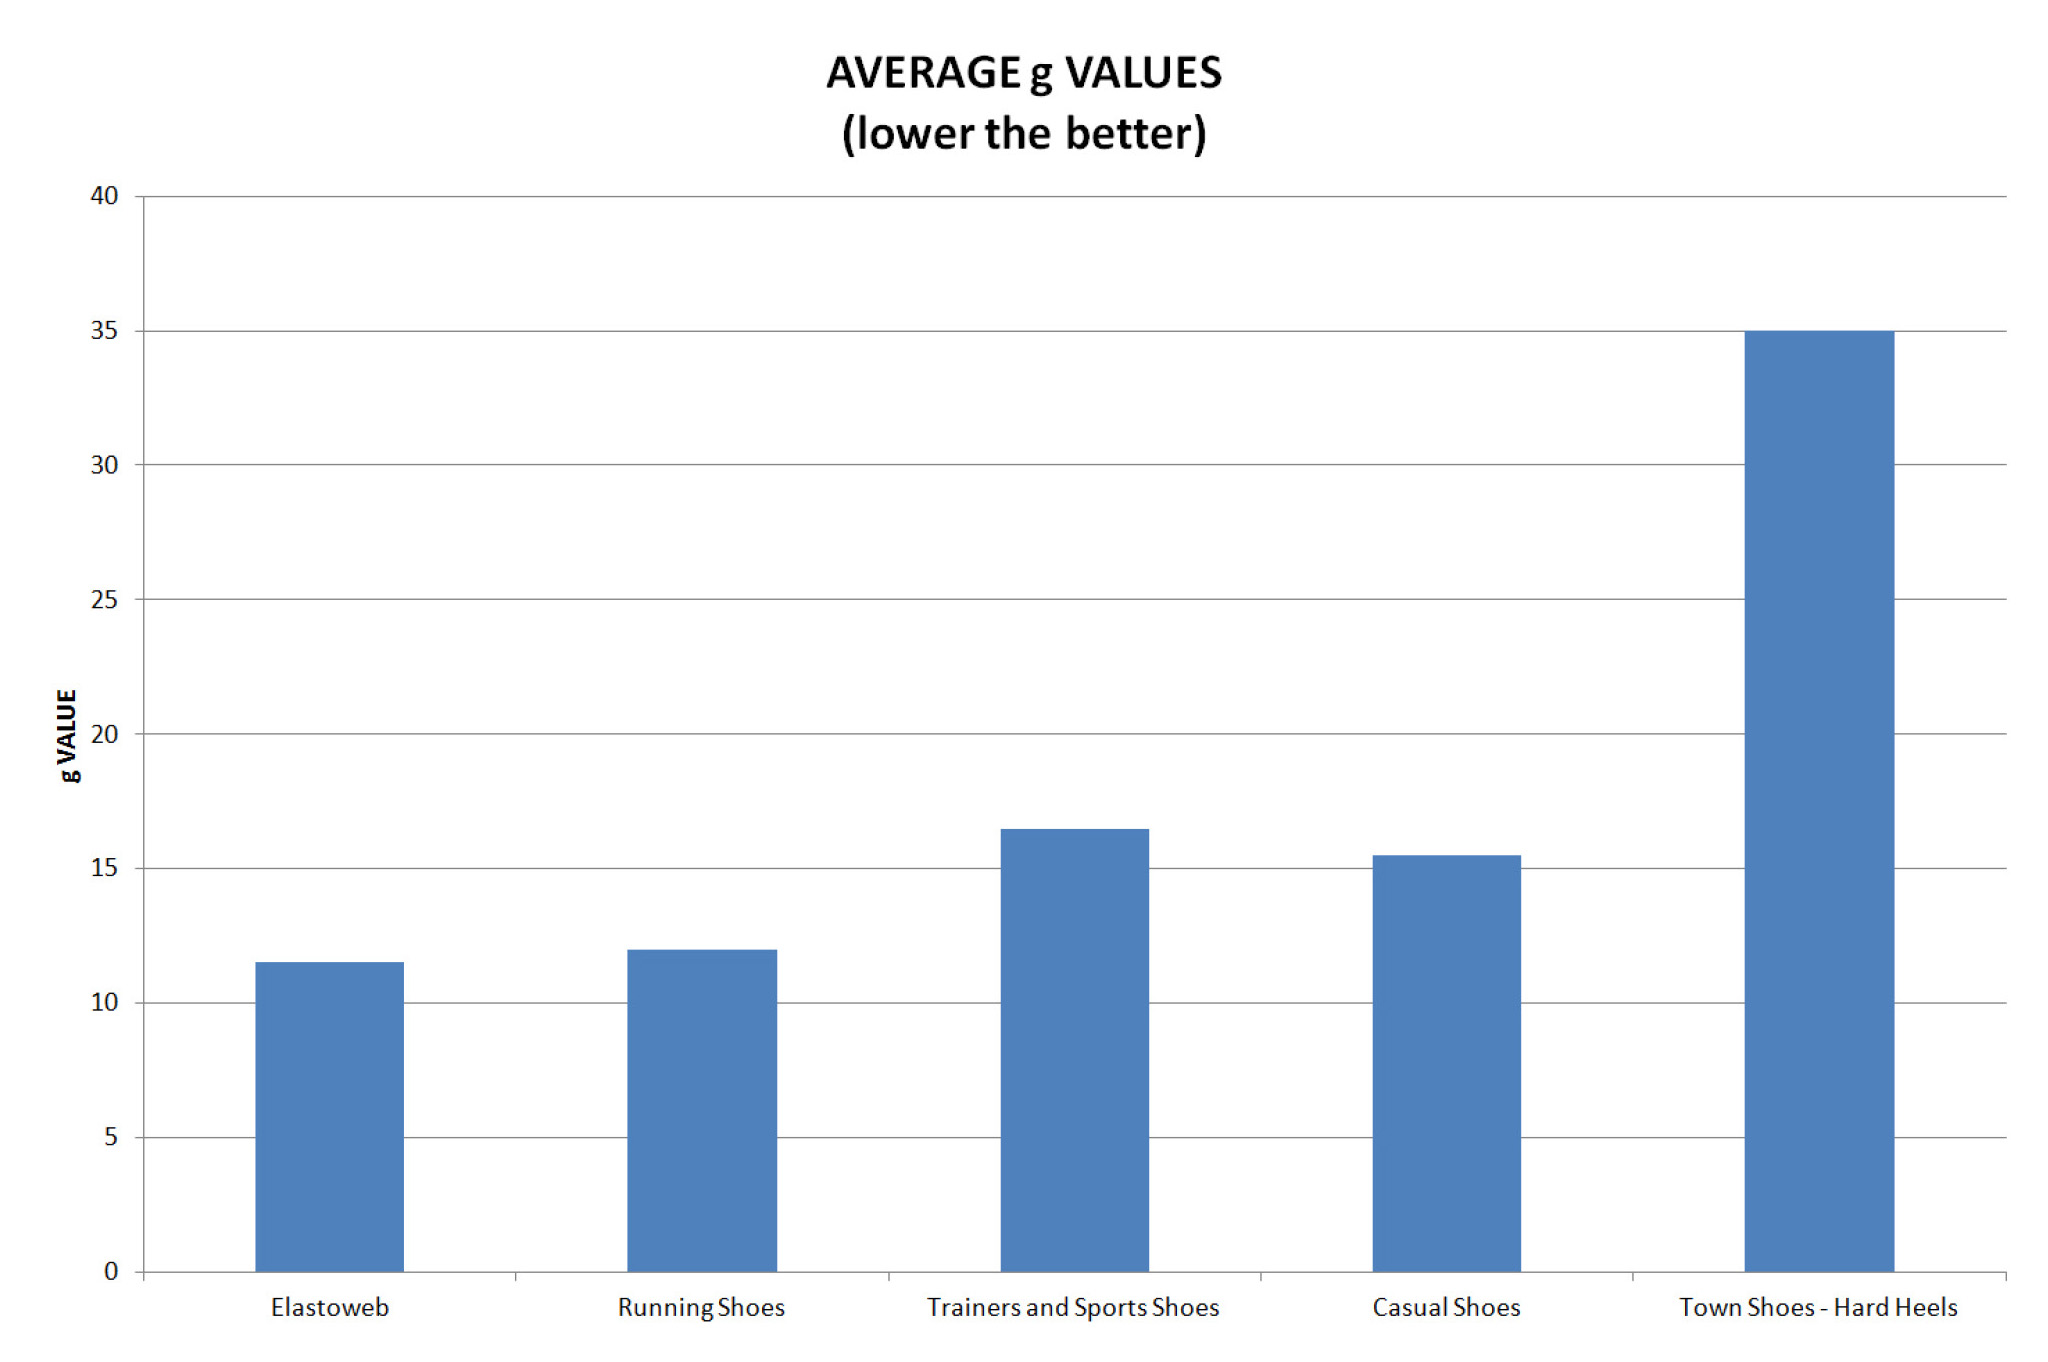 |
| 'energy return' divided by 'g value' ratio | average energy return values | average g values |